Free Online
Quartiles Courses and Certifications
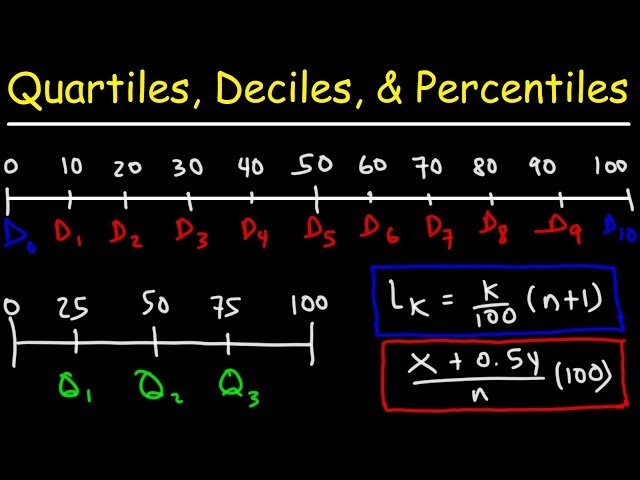
Understand and calculate quartiles, percentiles, and interquartile range to interpret and summarize data distributions. Learn to visualize data using boxplots and apply concepts like z-scores and standard deviation in real-world analysis. Access beginner-friendly tutorials on YouTube and Codecademy for hands-on practice.
Showing 17 courses
Filter by
Filters
-
-
Level
-
Duration
-
Language
-
-
- Codecademy
- 1 hour
- Self-Paced
- Free Trial Available
-
- YouTube
- 1 hour 32 minutes
- Self-Paced
- Free Video
-
- YouTube
- 35 minutes
- Self-Paced
- Free Video
-
- YouTube
- 25 minutes
- Self-Paced
- Free Video
-
- YouTube
- 12 minutes
- Self-Paced
- Free Video
-
- CodeSignal
- 1 hour
- Self-Paced
- Free Certificate
-
- CodeSignal
- 1 hour
- Self-Paced
- Free Certificate
-
-
- Codecademy
- 1 hour
- Self-Paced
- Free Trial Available
-
- YouTube
- 57 minutes
- Self-Paced
- Free Video
-
- YouTube
- 11 minutes
- Self-Paced
- Free Video
-
- YouTube
- 23 minutes
- Self-Paced
- Free Video
-
- YouTube
- 1 hour 18 minutes
- Self-Paced
- Free Video
-
- YouTube
- 14 minutes
- Self-Paced
- Free Video
-
- YouTube
- 17 minutes
- Self-Paced
- Free Video
-
- YouTube
- 2 hours 30 minutes
- Self-Paced
- Free Video
-


