Completed
How to Make Stem and Leaf Plots | Statistics
Class Central Classrooms beta
YouTube videos curated by Class Central.
Classroom Contents
Introduction to Statistics - AP Statistics Curriculum and Beyond
Automatically move to the next video in the Classroom when playback concludes
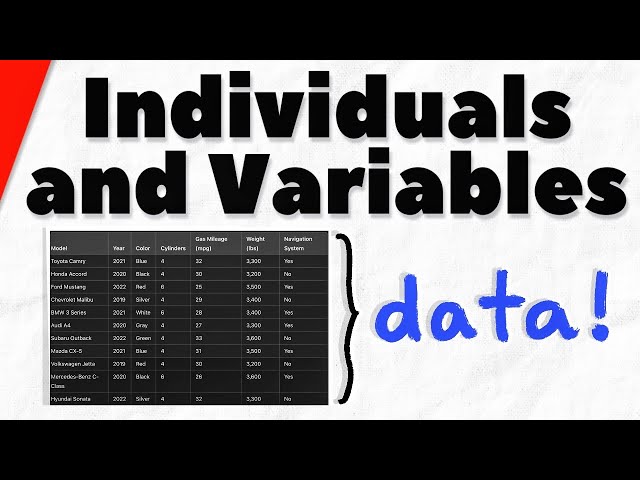
- 1 Individuals and Variables in a Data Set | Statistics
- 2 Categorical and Quantitative Variables | Statistics
- 3 Bar Charts and Pie Charts for Categorical Data | Statistics
- 4 The Area Principle (How to Make Good Charts) | Statistics
- 5 Two Way Tables and Marginal Distributions | Statistics
- 6 Conditional Distributions of Categorical Variables | Statistics
- 7 Segmented Bar Graphs and How to Make Them | Statistics
- 8 Associated and Independent Categorical Variables | Statistics
- 9 How to Make Stem and Leaf Plots | Statistics
- 10 How to Find the Interquartile Range of a Set of Data | Statistics
- 11 Finding Quartiles and the Interquartile Range of Data | Statistics, IQR
- 12 Find the Interquartile Range with Odd Data Set | Statistics
- 13 Find the Interquartile Range with Even Data Set | Statistics
- 14 Finding Outliers using Interquartile Range | Statistics, IQR, Quartiles
- 15 IQR vs Range (interquartile range vs range) | Statistics
- 16 Find the Mean of Grouped Data | Statistics, Grouped Frequency Tables
- 17 How to Find Standard Deviation and Variance (Sample and Population) | Statistics
- 18 How to Calculate z-Scores and Why | Statsitics
- 19 Find Percentile with Mean and Standard Deviation (Normal Curves) | Statistics
- 20 Find Coefficient of Variation | Statistics
- 21 Two Tail Hypothesis Test for Difference in Proportions | Statistics
