Completed
Normalize
Class Central Classrooms beta
YouTube videos curated by Class Central.
Classroom Contents
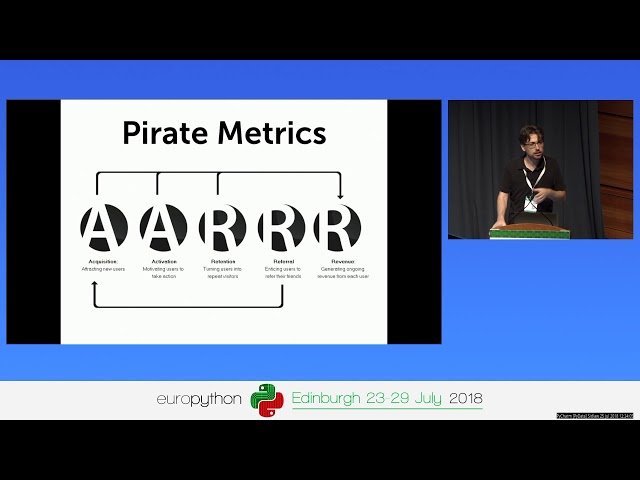
Using Bonobo, Airflow and Grafana to Visualize Your Business
Automatically move to the next video in the Classroom when playback concludes
- 1 Intro
- 2 Romains background
- 3 Goals
- 4 Bonobo
- 5 Private beta
- 6 World service
- 7 Data services
- 8 Grafana dashboards
- 9 Technical metrics
- 10 Metrics
- 11 Planning metrics
- 12 Business frameworks
- 13 Data pipelines
- 14 About Bonobo
- 15 Writing the code
- 16 Object Count Reader
- 17 Normalize
- 18 Write to matrix
- 19 Create graph instance
- 20 Filter metrics
- 21 Database connection
- 22 Linear status
- 23 Connecting to Google Analytics
- 24 Prometheus
- 25 Reducer
- 26 Graph execution
- 27 Algorithm
- 28 Graphing
- 29 What is graphing
- 30 Interface to configure graph
- 31 QoS
- 32 Number of spiders
- 33 Time to get a new picture
- 34 Public dashboards
- 35 Database Joins
- 36 Conversion Rate
- 37 Timeline Injection
- 38 cron jobs
- 39 what is a flow
- 40 Airflow architecture
- 41 GHG objects
- 42 Dikes
- 43 Connections
- 44 System Environment
- 45 Documentation
- 46 Timeboxed experiments
- 47 Canvases
- 48 Text
- 49 Assembly line
- 50 Books
- 51 Feedback
- 52 Flow vs Bonobo
