Completed
00:00 - What I've Been Doing
Class Central Classrooms beta
YouTube videos curated by Class Central.
Classroom Contents
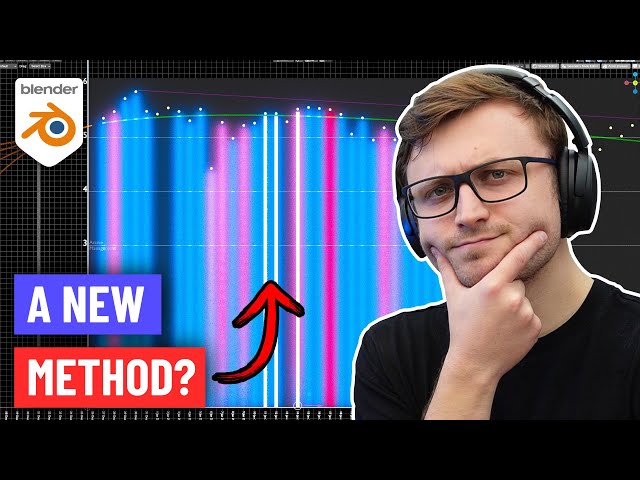
Data Visualization in Blender - Using 3D Software for Chart Creation
Automatically move to the next video in the Classroom when playback concludes
- 1 00:00 - What I've Been Doing
- 2 00:39 - A Chart in Blender
- 3 01:42 - Visualizing of Elements
- 4 02:48 - The Speculation System
- 5 03:09 - Overlapping Factors
- 6 04:22 - Thinking About Exoplanets
- 7 08:40 - Testing the Idea
- 8 10:11 - It Works!
- 9 11:03 - Potential of Multiple Approaches
- 10 12:06 - Just an Experiment
- 11 12:38 - Fuzzy Analysis
- 12 13:37 - Standards and Comparisons
- 13 14:48 - The Next Step
- 14 15:29 - Closing Thoughts
