Completed
1 - Descriptive Statistics
Class Central Classrooms beta
YouTube videos curated by Class Central.
Classroom Contents
Food Science Data Analysis - Basic Statistical Methods and Visualization Techniques
Automatically move to the next video in the Classroom when playback concludes
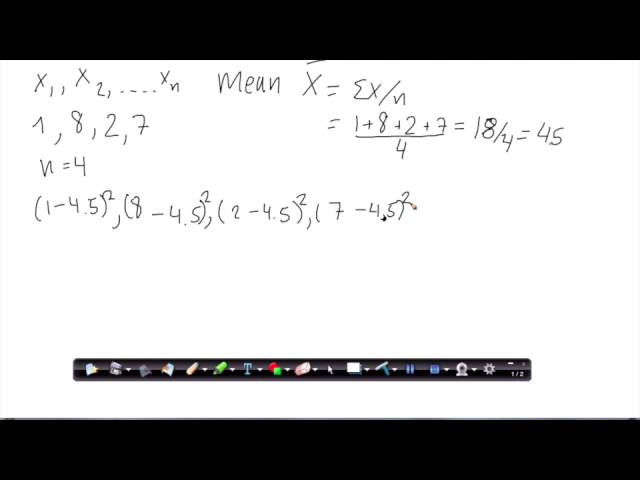
- 1 1 - Descriptive Statistics
- 2 2 - Plotting with ggplot2
- 3 3 - PCA concept
- 4 4 - PCA estimation, centering/scaling, variance explained and biplot
- 5 5 - Correlation and Covariance - Nuts and bolt
- 6 6 - Correlation and PCA
- 7 7 - Normal distribution
- 8 8 - Normal distribution Confidence Interval
- 9 9 - T-test
- 10 10 - T-test inR
- 11 12 - Categorical Data - Chisq test - how to
- 12 13 - Binomial distribution
- 13 14 - Binomial Distribution Test
- 14 15 - Binomial distribution - estimation
- 15 16 - Power calculation for the binomial distribution
- 16 17 - Power calculation for Ttest-data
- 17 18 - Power calculation for Ttest type data inR
- 18 19 - Oneway ANOVA
- 19 20 - Contrasts in ANOVA models
- 20 21 - Linear Regression (one X-variable)
- 21 22 - Least Squares Estimation of Model Parameters
- 22 Introduction to R Markdown
- 23 Introduction to jamovi
