Completed
Excel Lesson in Gregory's Physics Class #2: Formula For Plotting Theoretical Line With X-Y Scatter
Class Central Classrooms beta
YouTube videos curated by Class Central.
Classroom Contents
Excel for Physics Data Analysis and Charting
Automatically move to the next video in the Classroom when playback concludes
- 1 Excel Lesson in Gregory's Physics Class #1: Setup Data, X-Y Scatter Plot, Add Chart Labels
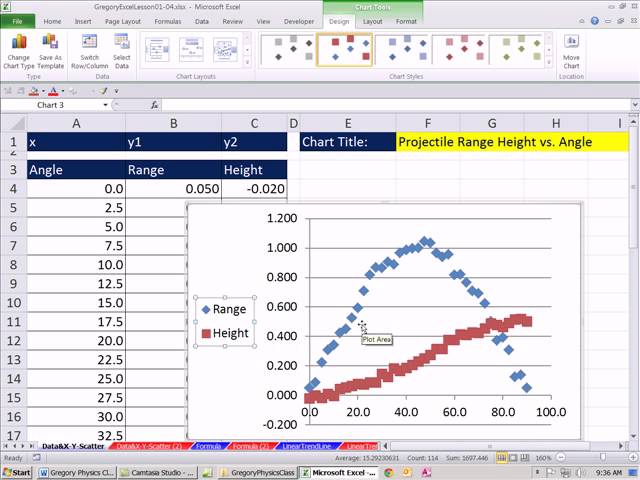
- 2 Excel Lesson in Gregory's Physics Class #2: Formula For Plotting Theoretical Line With X-Y Scatter
- 3 Excel Lesson in Gregory's Physics Class #3: Linear Regression Trendline in Excel Charting
- 4 Excel Lesson in Gregory's Physics Class #4: X Y Scatter Data Points &Theoretical Line In Same Chart
- 5 Plot F(x) Function & Chart In Excel - Gregory's Physics Class Acceleration of Block Up Down Ramp
- 6 Add 2nd Set of Points to Excel X – Y Scatter Chart (Excel Magic Trick 1517)
