Completed
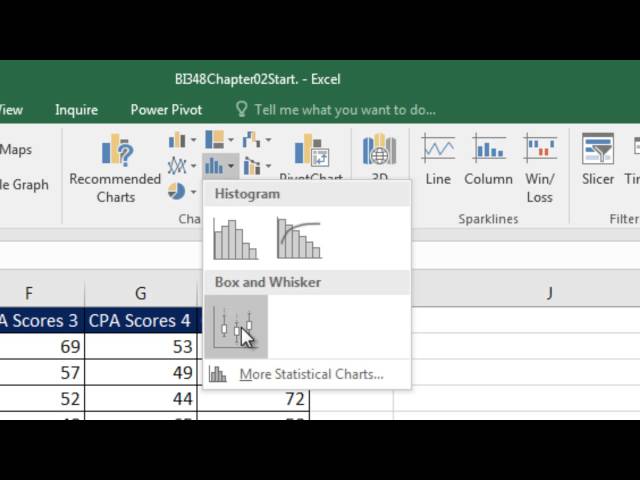
Basic Excel Business Analytics #26: Box & Whisker Plot. Chart Example in Excel 2016.
Class Central Classrooms beta
YouTube videos curated by Class Central.
Classroom Contents
Excel Box Plot and Box and Whisker Charts
Automatically move to the next video in the Classroom when playback concludes
- 1 Basic Excel Business Analytics #26: Box & Whisker Plot. Chart Example in Excel 2016.
- 2 Excel 2010 Statistics #28: Box & Whisker Plot: Stacked Bar with Mean Point Plotted and Outlier Lines
- 3 Excel Magic Trick #124: Box Plot or Box & Whisker
- 4 Excel Magic Trick #204: Scatter & Bar Chart Together
- 5 Excel & Statistics 49: Outliers & Box Plot with Median and Mean
