Completed
Excel 2010 Statistics 01: Introduction To Excel 2010 For Statistics
Class Central Classrooms beta
YouTube videos curated by Class Central.
Classroom Contents
Excel 2010 Statistics - Formulas, Functions, Charts, and PivotTables
Automatically move to the next video in the Classroom when playback concludes
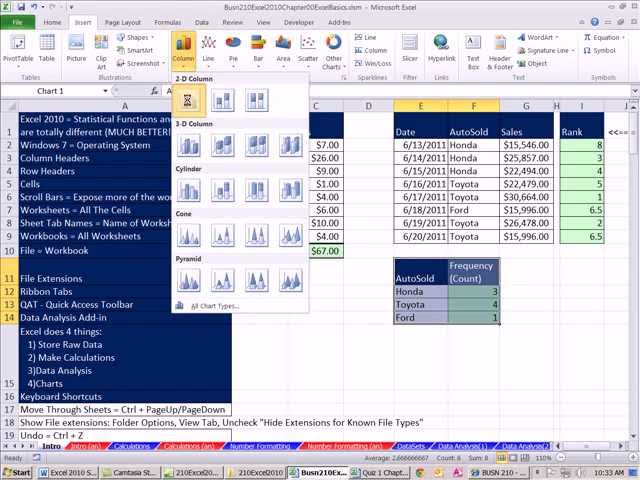
- 1 Excel 2010 Statistics 01: Introduction To Excel 2010 For Statistics
- 2 Excel 2010 Statistics 02: Excel 2010 Data Analysis Add-in
- 3 Excel 2010 Statistics 03: Calculations, Formulas, Functions, Math & Comparative Operators
- 4 Excel 2010 Statistics 04: Number Formatting As Façade Accounting Percentage Proportion Probability
- 5 Excel 2010 Statistics 05: Data Sets How They Are Setup & Terminology In Statistics & Data Analysis
- 6 Excel 2010 Statistics 06: Data Analysis: Sorting and PivotTables
- 7 Excel 2010 Statistics 07: Charts Basics: Pie, Column, Bar, Line and X-Y Scatter
- 8 Excel 2010 Statistics 08: Cell References In Formulas: Relative and Absolute
- 9 Excel 2010 Statistics 09: Proportions, Probabilities and Percentages: Formulas and Formatting
- 10 Excel 2010 Statistics 10: Percentage Change and Ending Balance Formulas
- 11 Excel 2010 Statistics 11: What Is Statistics?
- 12 Excel 2010 Statistics 12 Data Sets, Excel Tables For Formulas & Charts, Cross Sectional, Time Series
- 13 Excel 2010 Statistics 13: Scales Of Measurement: Nominal, Ordinal, Interval, Ratio
- 14 Excel 2010 Statistics 14: Descriptive & Inferential Statistics
- 15 Excel 2010 Statistics #15: Frequency Distributions, Histograms, Column Charts (11 Examples)
- 16 Excel 2010 Statistics #16: Relative & Percent Frequency Distributions & Pie Chart & Histogram
- 17 Excel 2010 Statistics #17 Ogive Chart Formula PivotTable Data Analysis Toolpak Add-in & Pareto Chart
- 18 Excel 2010 Statistics #18: Frequency Distribution Shape & Histogram Skew & Sparklines
- 19 Excel 2010 Statistics #19: Dot Plot Chart with REPT and COUNTIFS functions
- 20 Excel 2010 Statistics #20: Stem and Leaf Chart with REPT and COUNTIFS functions
- 21 Excel 2010 Statistics #21: Cross Tabulation With PivotTable Frequencies and % Column & % Row
- 22 Excel 2010 Statistics #22: Cross Tabulation With Formulas
- 23 Excel 2010 Statistics #23: Scatter Diagram to show Relationship Between Two Quantitative Variables
- 24 Excel 2010 Statistics #24: Conditional Formatting Cell Chart Histogram
- 25 Excel 2010 Statistics #25: Typical Values: Mean, Median, Mode
- 26 Excel 2010 Statistics #26: Location: Mean, Median, Mode, Percentile, Quartile, PercentileRank
- 27 Excel 2010 Statistics #27: Excel 2010 Functions for Percentile, Quartile and Rank
- 28 Excel 2010 Statistics #28: Box & Whisker Plot: Stacked Bar with Mean Point Plotted and Outlier Lines
- 29 Excel 2010 Statistics #29: Means: Weighted, Trimmed, From Grouped Data, Geometric Mean
- 30 Excel 2010 Statistics #30: Standard Deviation: How fairly does the mean represent its data points?
- 31 Excel 2010 Statistics #31: z-Scores, Chebyshev's Theorem and Empirical Rule
- 32 Excel 2010 Statistics #32: Detecting Outliers
- 33 Excel 2010 Statistics #33: SKEW function, Relationship between Mean Median & Mode and Skew
- 34 Excel 2010 Statistics #34: Data Analysis Add-in Descriptive Statistics tool
- 35 Excel 2010 Statistics #34.5: Z-Score IF, Standard Deviation IF, Mean IF, Mode IF, Median IF
- 36 Excel 2010 Statistics #35: Probability Basics (by hand notes)
- 37 Excel 2010 Statistics #36: Probability Basics with Excel
- 38 Excel 2010 Statistics #37: Probability Laws (by hand notes) Adding, Multiplying and More
- 39 Excel 2010 Statistics #38: Probability Laws in Excel, Adding, Multiplying, Conditional Probability
- 40 Excel 2010 Statistics #39: HYPGEOM.DIST and Conditional Probabilities New Excel 2010 Function
- 41 Excel 2010 Statistics #40: Joint Probability Table and More!
- 42 Excel 2010 Statistics #41: Joint Probability Table with PivotTable
- 43 Excel 2010 Statistics 42: Bayes' Theorem Posterior Probabilities & SUMPRODUCT
- 44 Excel 2010 Statistics 43: Further Explanation of Bayes' Theorem & Posterior Probabilities
- 45 Excel 2010 Statistics 44: Discrete Probability Distributions (Basics)
- 46 Excel 2010 Statistics 45: Build Discrete Probability Distribution
- 47 Excel 2010 Statistics 46: Discrete Probability Chart with 2 Data Sets
- 48 Excel 2010 Statistics 47: Discrete Probability Mean & Standard Deviation
- 49 Excel 2010 Statistics 48: Accounting & Finance Examples of Expected Value & Standard Deviation
- 50 Excel 2010 Statistics 49: Binomial Experiment, Probabilities, Chart and BINOM.DIST Function
- 51 Excel 2010 Statistics 50: BINOM.DIST Function (3 Examples) Mean & Standard Deviation for BD
- 52 Excel 2010 Statistics 51: How Shape Of Binomial Distribution Changes As n And p Change
- 53 Excel 2010 Statistics 52: Cumulative BINOM.DIST Chart with IF Function
- 54 Excel 2010 Statistics 53: POISSON.DIST function Poisson Probability Distribution
- 55 Excel 2010 Statistics 54: Continuous Probability Distributions (Basics)
- 56 Excel 2010 Statistics 55: Uniform Probability Distributions
- 57 Excel 2010 Statistics 56: Normal (Bell) & Standard Normal Characteristics
- 58 Excel 2010 Statistics 57: NORM.DIST, NORM.S.DIST, NORM.INV, NORM.S.INV Functions Bell Curve
- 59 Excel 2010 Statistics 58: Charting Normal Bell Curve In Excel With X and Z Values & Dynamic Ranges
- 60 Excel 2010 Statistics 59: Normal Bell Probabilities Above X & Area Charts To Show Area above X
- 61 Excel 2010 Statistics 60: Normal Bell Probabilities Between 2 X or Z Values Area Charts & Functions
- 62 Excel 2010 Statistics 61: Find X Given Normal Probabilities NORM.INV & NORM.S.INV Functions
- 63 Excel 2010 Statistics 62: Calculating Bell Normal Distribution Probabilities & X Values 10 Examples
- 64 Excel 2010 Statistics 63: Exponential Probability EXPON.DIST function
- 65 Excel 2010 Statistics 64: Relationship Between Poisson & Exponential Probability Distributions
- 66 Excel Magic Trick 839: Standard Deviation At Each New Value In Column
- 67 Excel Magic Trick 841: One Standard Deviation Above Mean, Count & Conditional Format Values
- 68 Excel 2010 Statistics 65: Sample Mean Xbar and Probability, Not X values
- 69 Excel 2010 Statistics 66: Simple Random Sample Using RAND Function, Sort and Copy Paste
- 70 Excel 2010 Statistics 67: Formula To Extract Simple Random Sample
- 71 Excel 2010 Statistics 68: Construct Sampling Distribution Of Samples Means (Xbar)
- 72 Excel 2010 Statistics 68.5: Sparklines to Compare Population and Sampling Distributions
- 73 Excel 2010 Statistics 69: Probability That Sample Mean Occur w/ Given Margin Of Error (3 Examples)
- 74 Excel 2010 Statistics 70: Standard Error and Correction Factor For Finite Populations
- 75 Excel Magic Trick 861: Conditional Format 50 Columns w Format Painter +/- 1 Standard Deviation
- 76 Excel 2010 Statistics 71: Sampling Distrib. Of X Bar As Sample Size Increase Probability Increase
- 77 Excel 2010 Statistics 73: Introduction To Confidence Intervals
- 78 Excel 2010 Statistics 72: Sampling Distribution of Sample Proportion
- 79 Excel 2010 Statistics 74: Confidence Intervals Sigma Known: NORM.S.INV, CONFIDENCE.NORM Functions
- 80 Excel 2010 Statistics 75 Confidence Intervals Sigma NOT Known T.INV, CONFIDENCE.T & Analysis Add-in
- 81 Excel 2010 Statistics 76: Confidence Interval To Estimate Population Proportion: NORM.S.INV Function
- 82 Excel 2010 Statistics 77: Determine Sample Size
- 83 Excel 2010 Statistics 78: Hypothesis Testing Population Mean, P-value & Critical Value, 1 Tail Right
- 84 Excel 2010 Statistics 79: 1 Tail Left z Distribution Mean Hypothesis Testing P-value Critical Value
- 85 Excel 2010 Statistics 80: Two Tail z Distribution Mean Hypothesis Testing P-value Critical Value
- 86 Excel 2010 Statistics 81: NORM.S Functions Hypothesis Testing p-value & Critical Values 7 Examples
- 87 Excel 2010 Statistics 82: 1 Tail Right t Distribution Mean Hypothesis Testing P-value Critical Value
- 88 Excel 2010 Statistics 83: 1 Tail Left t Distribution Mean Hypothesis Testing P-value Critical Value
- 89 Excel 2010 Statistics 84: Two Tail t Distribution Mean Hypothesis Testing P-value & Critical Value
- 90 Excel 2010 Statistics 85: T Functions Hypothesis Testing for p-value & Critical Values 11 Examples
- 91 Excel 2010 Statistics 86: Hypothesis Test for Proportions using p-value or Critical Value
- 92 Excel 2010 Statistics 87: Linear Regression #1: Scatter Diagram: Relationship Between 2 Variables?
- 93 Excel 2010 Statistics 88: Linear Regression #2: Scatter Plot with Trendline & X and Y Mean Lines
- 94 Excel 2010 Statistics 89: Linear Regression #3: Sample Covariance & Coefficient of Correlation
- 95 Excel 2010 Statistics 90: Linear Regression #4: Calculate Slope, Y-Intercept, Estimated Equation
- 96 Excel 2010 Statistics 91: Linear Regression #5: Coefficient of Determination: Goodness of Fit
- 97 Excel Magic Trick 1035: Calculate Median with 1 condition with AGGREGATE & PERCENTILE.INC function
- 98 Excel Magic Trick 1046: Linear Regression Estimate & Add Many Predicted Y-Values Single Cell Formula
- 99 Highline Excel 2013 Class Video 46: Statistics: Histogram Formulas & Chart in Excel 2013
- 100 Excel Magic Trick 1118: MODE for Text Values, Extract Word That Occurs Most Frequently
- 101 Excel Magic Trick 1117: Calculate Average For Each Sample: AVERAGEIFS, PivotTable, or OFFSET
- 102 Excel Magic Trick 1135: Rank Values From Two Columns: RANK.AVE, RANK.EQ & RANK Functions
- 103 Excel Magic Trick 1136: Correlation From 4 Columns: CHOOSE Array Formula “Mash” Columns Together
